 Site Explorer
 Keyword tool
 Google Algorithm Changes
You’re probably familiar with inbound.org, the online community that helps marketers stay connected. Putting it simply, inbound.org is an online hub where good marketers come to get better, the platform itself states. It’s a great place for sharing ideas, connecting, interacting or even finding a job.
Being in the industry, we always cast an eye over the platform as indeed, we’ve found very interesting pieces of content, needless to say about its very active community from which we could all learn a lot. We are even proud to say that some of our articles circulated on the hub and they performed quite well, giving us a some traffic on the blog but more important, a lot of feedback.

Yet, as much as we appreciate this platform, we were intrigued to find out what makes an article popular on inbound.org. Even more, what are the particularities of the most successful articles, members, which is the best day to publish, how long should an article be, etc.? And because we are big fans of research, we didn’t loose much time and we started digging “the community where world’s smartest marketers come to discuss & share what’s trending in the marketing world”.
TL;DR – This is an in-depth research and therefore a long article. If you don’t have time to read it all you can skip directly to the conclusions. Below you also have the list of the most important findings of the research.
- Publish Your Content at the Beginning of the Week for More Views and Upvotes
- More Than Half of All Articles on inbound.org Have Over 100 Views
- Top Most Viewed Articles Ever Are Google Related or AMA Discussions
- Three Quarters of All Articles Generate No Comments
- 15k inbound.org Articles Managed to Get More Than 10 Upvotes
- Half of the inbound.org Members Are from US and Have Management Positions
- Karma – A Big Influencing Factor for inbound.org Success?
- 60% of All inbound.org Users Have Never Left a Single Comment
- 80% of All inbound.org Users Don’t Have a Single Follower
- Members’ Favorite Tools and Blogs are SEO Related
- 90% of all Shared Content are External Links
- Straight to the Point Discussions Are the Most Engaging Ones
- Most Successful inbound.org Articles Are SEO Related
- The Most Active inbound.org Authors Are NOT Necessarily the Most Successful Ones
- More inbound.org Upvotes Also Bring More Views and Comments
- The Number of inbound.org Upvotes Alone is NOT an Indicator of Success
- There Isn’t a Strong Correlation Between the Number of Upvotes and Comments
- There is No Correlation Between Views and Upvotes on inbound.org
- The Number of Comments is a Strong Indicator for Getting High Karma Points on inbound.org
What We’ve Found from Analyzing Over 90,000 Articles and 60,000 Members
It is said that research is formalized curiosity. It is poking and prying with a purpose. And our purpose was not gathering data but seeing what interesting findings we can get with that data.
Below you will see a list of some of the most interesting outcomes that we discovered during our research but also findings that could help marketers better understand the inbound.org community.
You might ask: How did we manage to collect all the data we needed for a research of this scale? What we did was to crawl ALL inbound.org’s articles and members and gather as much data as we could in the period 10-15 March 2016. Although Inbound offers the possibility to use their API, we used our own crawler to gather all the necessary data for this analysis. Our crawler allowed us to have much more control over the research, gave us the possibility to double check the data when needed and, why not admit it, being made in “our laboratories” we know exactly how it works and we have full confidence in it. A public version of our crawler is going to be released somewhere next year so you will be free to give it shot then.
Talking about crawling, this is how we ended up analyzing over:
- 261,117 Crawled Pages
- 73,705 Shared Articles
- 107,581 Comments
- 60,891 Members’ Profiles
- 8,526 Discussions
- 2,245,457 Article Views
- 659,145 Article Upvotes
Of course, like any other research, this one has its limitations as well. For instance, the info that we are offering you is based in the crawling that was made on the period 10-15 March, as mentioned above. Therefore, being such a dynamic community, some of the articles’ number of views, upvotes or comments might have changed. We are also aware that the conclusion drawn on the articles written recently may not be very accurate. Yet, this number is very small and cannot change the overall outcome of the research.
Another thing that we want to highlight before letting you read our engaging findings is related to the number of inbound.org’s members. On inbound.org’s member page we are offered the information that there are 158,823 participants in the community. However, after our crawling process we found 60,891 members. As we were intrigued by this fact and we wanted to be sure that the data we are researching is accurate, we went browsing through all their members on the site. The results found here confirmed our findings. If you go to the last page of members on the inbound.org page, you will see that the last one listed was #63,034 ( a couple of days after the crawl was done, this number might have changed since then), as you can see in the screenshot below. We don’t know exactly what the source of this discrepancy is but we do know that we crawled and analyzed all inbound.org’s public members and they were 60,891 at the time of our crawl.

Yet, as we were really curious to find out why such gap occurred, we’ve asked Casey Henry from inbound.org who told us that “while we do have over 150,000 members on the site, they are not all listed in the directory of members. We exclude members who have low karma and even some who have not connect Twitter to verify they are real accounts”.
FINDING #1 Publish Your Content at the Beginning of the Week for More Views and Upvotes
The current wisdom for most social media strategies is that we should reserve our best posts for the days right before the weekend, if we want a bigger reach .
[inlinetweet prefix=”” tweeter=”” suffix=””]The former part of the week yields the highest number of views when publishing new content.[/inlinetweet]
The explanation, however, might be the same for both scenarios: the less people want to be at work, the more they’re likely to look for outlets. There are other things to take into account as well, such as the fact that during week-ends, quite a few people tend to try and stay away from technology, while during weekdays a lot of them are glued to their 9-to-5 desk jobs.
This is true about upvotes as well. On average, the first four days of the week hold more than one upvote over the week-end days. Saturday actually holds 2 upvotes less, on average, than Monday through Thursday. It’s probably not that people aren’t willing to engage with other people on Saturday, but that they’re more willing to do so in real-life social activities, rather than virtual ones.
FINDING #2 More Than Half of All Articles on inbound.org Have Over 100 Views
As on any platform, there are pieces of content with 0 views and others with thousand of views (in our case even million of views). However, these represent the extremes and we are not going to draw general conclusions starting from those. However, if we look at the chart below, we can see that most of the article (around 22,000 representing 22% of all articles) have somewhere between 101 and 200 views. That’s quite impressive and it becomes even more if we think that more than half of the total number of articles have over 100 views.
This says a lot about the community but also about the popularity of the articles. We are looking at a very active community, who publish but also visualize a lot of articles. Popularity does not mean necessarily quality so we avoid saying something like “half of the articles from inbound.org are of great quality”.
[inlinetweet prefix=”” tweeter=”” suffix=””]Over 50% of all @inboundorg articles are medium to high popular.[/inlinetweet]
Not to mention that the number of articles having between 0 and 10 views it’s very low – somewhere around 1,5 % of the total number of articles.
FINDING #3 Top Most Viewed Articles Ever Are Google Related or AMA Discussions
As seen above, most of the articles have somewhere between 101-200 views. However, we were interested to see how top 50 most viewed articles ever look like.
[inlinetweet prefix=”” tweeter=”” suffix=””]AMA discussions hold the first positions in the top most viewed articles on @inboundorg[/inlinetweet]
Even if it’s about Rand Fishkin, Avinash Kaushik or the confession of a “Google Spammer”, it seems like these kind of Q&A sessions get a lot of traction.
Along with them, Google related articles are also very successful and, as expected, are among the most popular from the top most viewed articles.
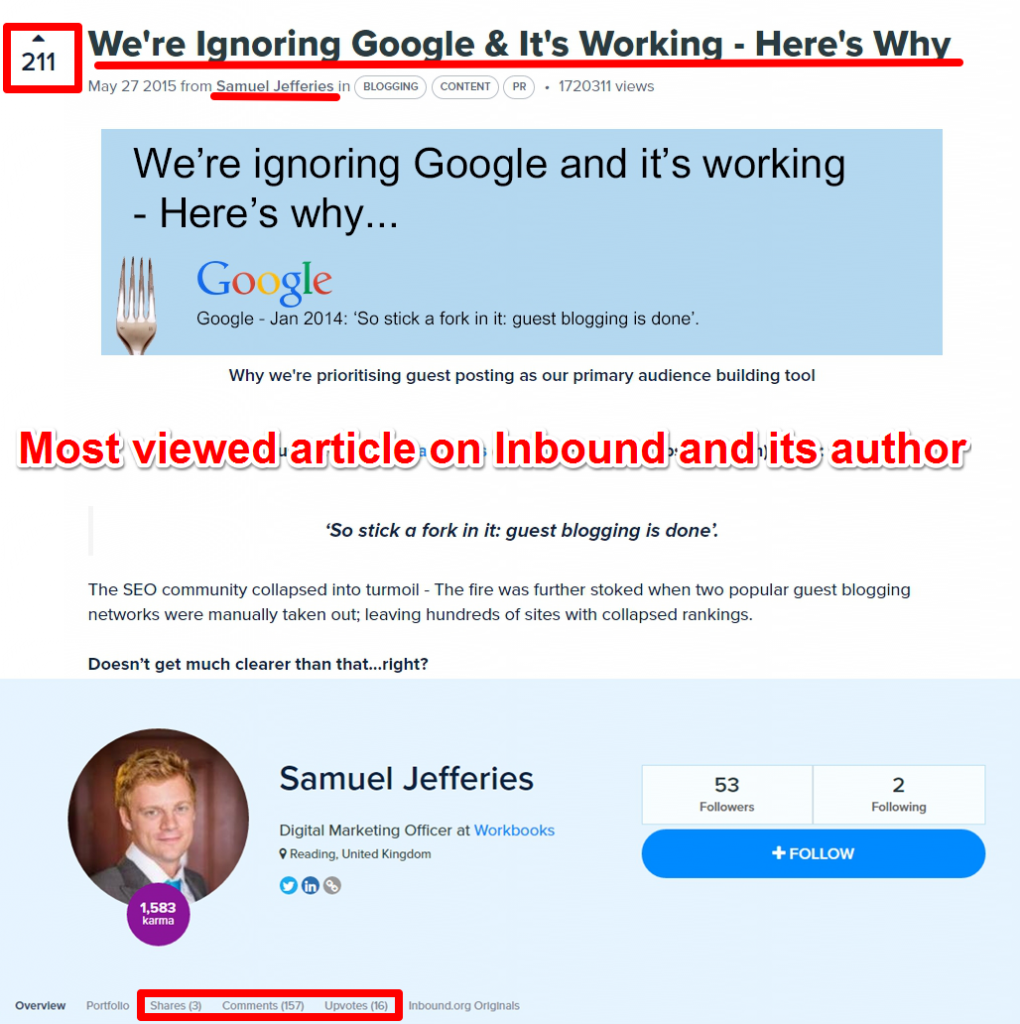
It seems like the most viewed 50 articles have all 30,000 views. Quite a lot, right? And although it’s an exception, the first article of this top caught our attention. It has over 1.7 million views out of a total of 32 million views that all articles on Inbound have. So what is this content’s topic that managed to gather so many views? The answer is simple and straightforward and can be easily deducted from the title: We’re Ignoring Google & It’s Working – Here’s Why. The main idea of the article is related to SEO and the problematic Guest Posting, a theme that is still making a stir in the digital marketing world.
At a closer look at the article, we can see that it doesn’t have so many upvotes, or at least not such an impressive number as the number of views, “only” 211. It’s author instead has a more impressive profile: 1583 karma and over 150 comments. Even on its profile, the number of upvotes aren’t impressive at all.
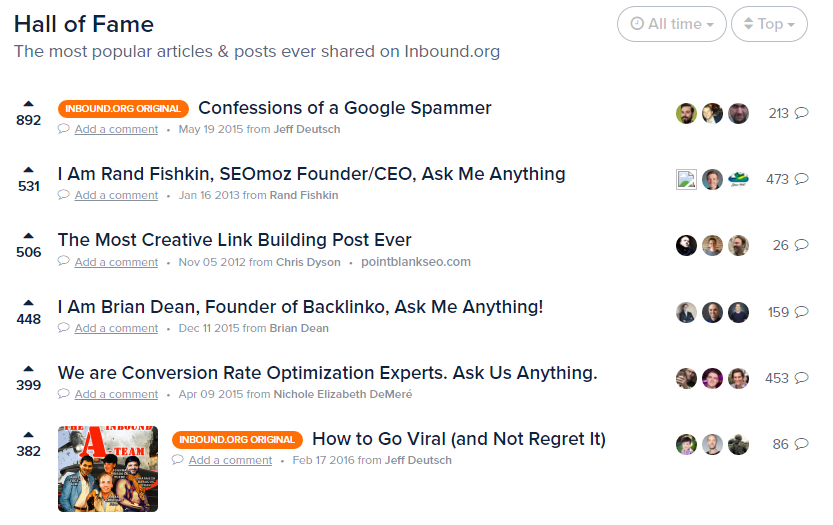
The third position of our top three is held by another article whose title doesn’t leave much room for interpretation: Confessions of a Google Spammer . With around 200,000 views and 200 comments it doesn’t manage to beat the article mentioned above, yet, it has quite an impressive performance, especially in the number of upvotes. This is the only category where it outperforms the most viewed article on inbound.org: almost 900 upvotes versus 200 held by our gold star. This results flagged us a finding that we’re going to explore a bit later: the correlation between the number of views, comments and upvotes. For now, we are intrigued by the fact that Google related content attracts a great number of views. If we were to calculate from top 50 most viewed articles, it looks like content that has “Google” in its title (not Google related but in the title) represent almost 10% of all views from any content on inbound.org.
FINDING #4 Three Quarters of All Articles Generate No Comments
[inlinetweet prefix=”” tweeter=”” suffix=””]A lot of content doesn’t necessary mean a lot of engagement as well.[/inlinetweet]
In fact, Pareto’s principle seems very much at home on inBound. Close to three quarters of all articles generate no comments (74.11%, to be more exact). Articles with between 1 and 10 comments amount to most of the remaining quarter (23.56%, specifically).
What about articles generating a modicum of engagement, say, articles with between 11 and 100 comments? They only make up 2.25% of all articles. And now, meet the real 1% of inbound.org (though the real percentage is even smaller than that, at 0.08%): the articles which generate significant talk, with between 101 and 1000 comments. It all seems very lopsided, but in truth that’s a mere representation of all information on the Internet. There are loads and loads of data which most users never really interact with.
[inlinetweet prefix=”” tweeter=”” suffix=””]The information that we see all over the place and react to, that’s likely a drop in the ocean of vast online data.[/inlinetweet]
After you remove the articles with 0 comments to only leave posts with at least some engagement, you can actually see the numbers on the chart for articles with tens or hundreds of comments. What we see confirmed is what makes sense intuitively: it becomes increasingly difficult for an article to get more comments, i.e. that the relation between number of comments and number of articles is linear (and inversely proportional).
There are many more articles with 1 to 10 comments than there are with 11 to 20 comments. There are also a lot more articles with 1 to 50 comments than there are with 51 to 100 comments.
But what makes an article that great that tens and maybe even hundreds of people feel the need to add their input? Is it the subject? Is it the fact that it has already become popular and people want to see what it’s all about? Both explanations might be at work here, or better yet, an interplay between the two.
FINDING #5 15k inbound.org Articles Managed to Get More Than 10 Upvotes
Upvotes are the other metric for engagement to take into account. It bears noting, though, that they are indicative of a lesser degree of engagement (much as Likes are less engaging than Commenting or Sharing on Facebook). The relation between number of upvotes and number of articles is also quite close to a linear (inversely proportional) one: fewer articles have more upvotes.
There are, however, instances where the linearity strays. For instance, there are many more articles with 1 upvote (over 29,000) than there are with 0 upvotes (just a little over 2,000). That’s almost 15 times more articles that have at least 1 upvote than articles that have 0 upvotes. This, too, can be made sense of: it’s likely that most users have at least a friend who follows their activity and will upvote an article or post, even if no stranger will.
It’s also likely that most articles will elicit a reaction from at least a few people and that one of those reactions will be a positive one. There is another instance where linearity is broken, however, which is a bit more puzzling. There are significantly more articles with 3 upvotes (over 10,300) than there are with 2 upvotes (over 6,000). This type of occurrence doesn’t seem to be repeated anywhere else on the spectrum and doesn’t lend itself to easy, intuitive explanations.
FINDING #6 Half of the inbound.org Members Are From US and Have Management Positions
There aren’t a lot of surprises when it comes to the country make-up of the user base.
[inlinetweet prefix=”” tweeter=”” suffix=””]More than half of the @inboundorg users are from the US (over 14,000).[/inlinetweet]
This is more than 4 times the number of users from the next country, India (over 3 200). The fact that these two countries are the two main sources is no random feat: while the US is still the largest global player in the tech sector, India may very well be the fastest growing one. UK and Canada, the next contributors, are also traditional power players in the tech industry, coming in 3rd and 4th.
The rest of the list also boasts some predictable findings (Germany or Israel and, to a lesser extend, Spain or Poland) but also some unexpected names and some glaring omissions. Mexico, Pakistan or Philippines, for instance, may not be big players in and of themselves (yet), but their graduates are definitely very sought after by companies in already developed tech sectors.
What about the lack of major power players from Asia, such as South Korea or Japan, currently considered to be among the most innovative? As cliche as it may sound, this might be a good time to bring up that chapter from the intercultural studies which highlights that most Eastern-Asian cultures conceive of „directness in stating the point, purpose, or conclusion of a communication“ as not being „appropriate“ . In other words, it’s likely that the cultural preference for harmony, context cues and politeness over assertiveness, directness and conflict might make forum-based interactions less attractive, in general, for tech professionals from these countries (despite their qualifications in the field).
The fact that more than 95% of users explicitly mention that they are not looking for work suggests that a lot of them are probably professionals, supporting the country and cultural-specific analysis above. It’s only reasonable to assume some users may not be looking for work for a variety of reasons (they’re not interested, they’re still in school), but by and large it’s plausible that most of them are already working.
[inlinetweet prefix=”” tweeter=”” suffix=””]More than half of the @inboundorg users (60% or 29,536) do not disclose their job title.[/inlinetweet]
Of those that disclose their job titles, most people describe themselves as CEO (1,728), founder (1,126) or owner (983). This might seem somewhat surprising if you’re thinking in terms of companies, perhaps rightly suspecting that most CEOs wouldn’t have the time to be active users on various online platforms, even those focused on the digital world.
It might, however, make a lot of sense if you’re thinking start-ups and entrepreneurship, both of which have found extremely fertile ground in the tech and digital fields in the past few years. Beyond these titles and a few similar others (such as „director“, „co-founder“, „president“ or „manager“), most other titles don’t really amount to very high numbers. This, in itself, might be misleading however.
The tech universe is notoriously adept at creating ever new and sometimes even straight-out ridiculous new titles. It also seems to be fairly successful at duplicating job titles (or multiplying titles that look very similar). Do we know what the difference is, in every case, between an account director, account executive and account manager? Is there always a clearly defined boundary between „blog writer“, „blogger“, „blogger and content writer“ or „blogger and seo expert“? What does a „brand evangelist“ (there are 5 of them) do that a „brand strategist“ or „brand manager“ cannot? The lines between „coordinator“, „executive“ and „manager“ are often blurred, so it’s difficult to make heads or tails of the entire classification. It’s not difficult, however, to recognize that the main field of interest is clearly defined by some not so ambiguous terms: „branding“, „digital“, „marketing“, „seo“, „social media“, „web design“ etc.
FINDING #7 Karma – A Big Influencing Factor for inbound.org Success?
If you’re familiar with various social interaction platforms such as Reddit, you might have already heard about Karma. It is usually measured with a score which stems broadly from being active and engaging with content and other users. In terms of inbound.org Karma, there’s a couple of quirks to notice.
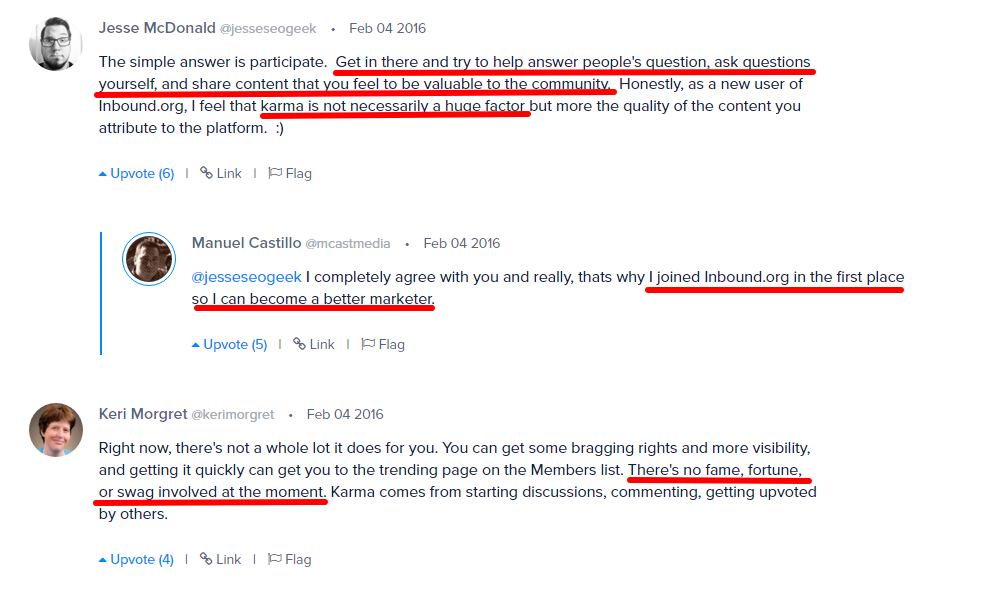
First of all, you can get negative Karma, potentially for not respecting the platform rules. Quite a few users (over 400) got negative Karma, suggesting that the algorithm might be used for educating users. We browsed through a conversions among inbound.org members regarding the importance of karma and we were pleased to see that most of the people are in for the added value that the platform is bringing to them and not necessary for the influence the points can give them. Below you have a snippet from one of their conversations on this matter.
Second, unlike the other metrics we’ve looked at so far, this time we’re not seeing a clear linear relation between the Karma score and the number of users. For instance, there’s a lot of users with 0 Karma (which makes sense, because on any platform most users are „lurkers“ and engage very little) and there’s fewer users with a Karma score of 1 (roughly 3,400) and even fewer with a Karma score of 2 (925). However, there’s significantly more people with a Karma score of 3 (over 2,500) than with a score of 2.
There’s again fewer people for an increased Karma score of 4 (roughly 700), but more people for an even higher Karma score of 5 (more than 1,600). There are slight variations up until and including a Karma score of 10, though it becomes more linear after that. The main reason for this non-linear relation might be the fact that Karma can evolve in a negative direction as well, which makes it more dynamic and less predictable.
[inlinetweet prefix=”” tweeter=”” suffix=””]600 @inboundorg users (from 60k users) have a Karma score higher than 1 000.[/inlinetweet]
While Karma doesn’t usually come with very tangible advantages, it can help with visibility in certain contexts. If that’s the case though, even someone with a score of more than 100 might have something to gain, in which case the percentage of „influent“ users is a lot higher, though the exact percentage number (20.58%) recalls another trope, that of the Pareto principle (which in this case could roughly be translated as 80% of things are created/influenced by 20% of individuals).
Some of the inbound.org “stars”, which can be seen in the chart below, have an outstanding performance. Let’s take Umar Khan, for instance. With a karma of over 26,000 it’s not hard to understand why the marketer is mentioned in top inbound.org members. Among the most prolific members can be found known names in the industry but also active members that are not well known in the digital marketing world but are bringing for sure added value to the industry. Let’s not forget that this “Top 100 list” is valid for the period of time that we’ve made the research (10-15 of March). As karma is such a volatile metric, the top authors by karma can look totally different from today’s chart.
FINDING #8 60% of All inbound.org Users Have Never Left a Single Comment
To what extent does karma match actual activity? Over 60% of all users have never left a single comment on inbound.org (the „lurkers“ we were referencing earlier). This doesn’t mean they might not be active in other ways (reading, sharing), just that they do not contribute to the conversation.
Together with casual commenters (roughly defined as users with between 1 and 50 comments), they make up close to 98% of all users. Frequent commenters (between 51 and 100 comments) and regular commenters (more than 100 comments) each make up about 1% (closely mirroring the „Karma elite“).
FINDING #9 80% of All inbound.org Users Don’t Have a Single Follower
Another way to measure success might be the number of followers a user has. Having followers means other users are so interested in what you have to say that they might choose to be specifically notified of any contribution (post or comment) you will make on the platform. Not a lot of people manage to be that convincing and knowledgeable. In fact, 80% of all users don’t have a single follower (reinforcing the 80-20 principle).
There are quite a few users with moderate success (roughly 11,600, or 18.67%), meaning with between 1 and 50 followers, but very (very) few users with „star power“, meaning over 100 followers: just 0.002% (that’s just 127 users out of more than 60,000). These are likely people who are frequent or regular commenters and also people with a high Karma score. While the exact relation between number of followers and Karma score is not clear, it stands to reason that they could both influence each other (supporting a theory that we often put forward, namely that quality content really is king when it comes to online presence).
FINDING #10 Members’ Favourite Tools and Blogs are SEO Related
[inlinetweet prefix=”” tweeter=”” suffix=””]. @inboundorg users are mostly focused on digital marketing .[/inlinetweet]
Most users do not have a listed favorite blog; in fact, just 0.5% of all users list a favorite blog.
However, that’s still more than 2,300 users, so a sizable sample. Of the preferences expressed by these users, SEO related blogs occupy a special place. In fact, they occupy 8 of the 10 spots in the top ten list. Moz, Quick Sprout, Search Engine Land, all are preferred by more than 100 users. Other blogs with over 50 favorites include Backlinko, Moz, Copy Blogger, Search Engine Journal or Social Media Examiner. Most of these websites happen to be the most popular SEO blogs all-around, reinforcing the idea that at least a small percentage of the inbound.org users are highly knowledgeable professionals, deeply involved in public discussions and with a constant interest in staying up-do-date and at the top of the game.
When it comes to the tools preferences, things don’t change much. Just a small part of the total users (under 10%) filled in the tool preferences section.
It seems that users are much more eclectic in their preferences when it comes to the apps and tools they use. In fairness, SEO itself is very eclectic in terms of the abilities and knowledge it takes to be proficient and efficient at it. Where else are you going to find a list of tools that includes Hubspot, Google AdWords, MailChimp, Twitter Analytics, Feedly, WordPress, Survey Monkey, Evernote or even iTunes?
FINDING #11 90% of the Total Content Is Represented by External Links
Almost 90% of all content is made up of just external links. Discussions amount to barely 10% of the inbound.org content. This probably explains why high Karma scores are hard to get by, since discussions are exactly the kind of things that can get you points.
[inlinetweet prefix=”” tweeter=”” suffix=””]Getting involved in @inboundorg discussions suggests you are trying to provide valuable insights[/inlinetweet]
The latter can also be seen as adding to the insight pool, but it doesn’t have the same to potential to generate new ideas. Of those discussions, many don’t even take off.
[inlinetweet prefix=”” tweeter=”” suffix=””]Discussions on @inboundorg drive a lot more views, clicks and engagement than articles. [/inlinetweet]
However, engaging discussion are preferred in the detrimental of just dropping links which no one engages with (as we’ve seen in our previous charts).
As you can see in the screenshot below, extracted from publishers guide to getting promotion on inbound.org, it seems like the discussions and the original content posted on inbound.org blog has the highest expected reach. Therefore, even though the overwhelming majority of content is represented by links, that isn’t necessary the place where marketers should focus on when it comes to inbound.org.

FINDING #12 Straight to the Point Discussions Are the Most Engaging Ones
[inlinetweet prefix=”” tweeter=”” suffix=””]Writing content can be difficult, getting people to engage with content can be even more so.[/inlinetweet]
Proof is that almost half of all the threads don’t ever take off (which is what it means that 47.87% of discussions have 0 words; it’s true that it might be other type of content as images, videos or polls; yet, as they don’t have any further comments with words it’s most likely that there weren’t very successful pieces of content). A further third don’t even hit 100 words. If you want to imagine what that looks like, just think that a 15-20 words sentence is considered standard by some in academia. So that thread is over with barely 5-6 comments in.
A fifth of all discussions run a bit longer, from 100 up to 500 words. This could translate into threads with somewhere between 25 and 30 comments, if we’re using the average sentence metric. There might be a bit more insight in these threads, but factor in some off-topic replies and you’re still short of truly valuable content.
However, as a marketer you might be interested what type of discussion is considered to be valuable and could get you some insights. It seems like discussions that go between 500 and 1000 words are probably where the interest should be, yet very few discussions get to that point. However, these discussions are performing really and they seem to be really engaging.
While not entirely impressive, these threads are bound to have at least some valuable insight (even when you factor in random jokes, small quarrels and various users going off tangents). Are there discussions upwards of 70 comments, maybe even 100? There sure are, but they only amount to 71 out of a sea of over 8,500 (less than even the famed „1%“). Worth bearing in mind when going back to the numbers for Karma points or users with tens of followers.
If we take a look at the total number of views generated by discussions and inbound.org blog posts, we can see that unlike in the case of external link, most of the discussions and posts have a very high number of views.
Needless to say that, if we look at the inbound.org’s Hall of Fame articles, we can see that top content is represented by inbound.org blog posts and discussions, as we’ve mentioned before.
Once again, quantity does not equal quantity and what marketers should stress on shouldn’t be just external links but discussions and blog posts as well.
FINDING #13 Most Successful inbound.org Articles Are SEO Related
By and large, it’s all about SEO on inbound.org, whether the key word that describes an article or topic is actually „seo“ or something that is entirely consequential to it.
[inlinetweet prefix=”” tweeter=”” suffix=””]Most @inboundorg articles are explicitly about „seo“ (534 out of roughly 3 000, or close to 18%).[/inlinetweet]
But if you look closer, it’s not as if the other key words are completely remote from the subject. Quite the contrary: „content“ is the next most popular word, representative for 11% of all articles, while „social“, „conversion rate optimization“ or „blogging“ each amass between 100 and 500 articles under their belt. The top ten is completed by „link building“, „community“, „strategy“ and „growth hacking“, all within the boundaries of the SEO industry. The top ten words are roughly responsible for 60% of all articles. It gets more varied afterwards, as the tags make room for „entrepreneurship“, „future of marketing“, „e-commerce“ or „branding“, but it doesn’t really stray away from the core discussion topic.
FINDING #14 The Most Active inbound.org Authors Are NOT Necessarily the Most Successful Ones
You would probably expect that there would be a correlation between the authors with the highest number of articles written and the ones which have the most upvoted articles. It seems like quantity, once again, does not mean quality. Below you will see 2 charts: one with authors with the highest number of articles and one with the authors of articles with more than 50 upvotes. If you thought that the two charts would overlap, you’d be wrong. There are indeed some names that are to be found on both lists. Yet, this is not the general rule
Looking at most successful writers against the most successful content highlights that winning battles is no guarantee for winning wars.
The most successful users (i.e. top authors with most articles that have more than 50 upvotes) are not necessarily the same as record holders for the most successful articles (in terms of sheer upvote numbers).
The prime example is that the user who authored the most upvoted article (with a staggering 1,149 upvotes) doesn’t show up in the top 20 successful authors.
This is the difference between bands that are mostly remembered for that one hit, even though they have a pretty significant catalogue and bands that never reached particular hights with any one single, but came in the top 10 or top 20 consistently.
FINDING #15 More inbound.org Upvotes Also Bring More Views and Comments
Of course, there’s always the question of what „good“ content actually means. Popularity does not equal quality (the music analogy springs to mind again), although in this particular case, if we accept the assumption that a significant part of the audience is made up of knowledgeable, even expert users, popularity might be an important indicator of quality.
Throughout our research we took upvotes, comments and views as “popularity” factors. We’ve analyzed each of these factor above and from each of them we’ve concluded some ideas. Yet, it was important for us to see if there is a correlation between these 3 factors. And as the charts below indicates, it looks like there is.
[inlinetweet prefix=”” tweeter=”” suffix=””]The number of views and comments on @inboundorg grow exponentially with the number of upvotes.[/inlinetweet]
If an article with about 70 upvotes has around 14 comments and 2,500 views, one with 300 upvotes can go up to 53,000 views and 100 comments. And, as stated above, even though popularity does not necessarily mean quality, the correlation that we’ve just highlighted reinforces the idea that success on inbound.org is also defined by upvotes, views and comments.
FINDING #16 The Number of inbound.org Upvotes Alone is NOT an Indicator of Success
What make a piece of content unsuccessful on inbound.org? Is there a “failure formula” that one should avoid?
As there isn’t a “secret formula” for success, there isn’t one for failure either (we know there might be some ideas here, though). However, we found some commonalities for articles that didn’t perform so well in terms of upvotes. Just as in the situation above, it seems like the exponential growth in number of views and comments for the upvoted articles is maintained: the more upvotes, the more numbers of views and comments.
Yet, there is a very interesting particularity here that we don’t find elsewhere. And this “extravagance” applies for the articles with 0 upvotes. It seems that even though they have 0 upvotes, they are not scoring the same numbers in terms of comments and views. Au contraire.
In terms of comments, inbound.org articles with 0 upvotes are performing way better than articles with 10 upvotes
Same goes for the number of views : articles with 0 upvotes are performing quite similar with articles that have 7 or 8 upvotes.
What we can conclude from here is that the number of Upvotes alone is not necessary an indicator of success. Upvotes need to be correlated with number of views and comments before drawing any conclusion. Also, if you are putting all your efforts in getting upvotes on inbound.org more than anything else, you might need to re-think your strategy.
FINDING #17 There Isn’t a Strong Correlation Between the Number of Upvotes and Comments
It’s true that we cannot generalize but, one would expect that articles with the most views to have an exponential growth in what concernes the number of comments and upvotes, our chosen “vanity metrics” to define an article’s success. Or at least we would.
We took for analysis all articles with more than 10k views to analyze their “behaviour” in terms of comments and upvotes. What we discovered suprized us a bit. It seems like there isn’t a strong connection between the number of upvotes and comments when we talk about articles with more than ten thousand views. As you can see in the chart below, most articles have much more comments than upvotes.
inbound.org members seem to be more engaged in discussions by commenting to articles rather than upvoting them.
However, we cannot say the same things for articles with more than 100 upvotes and comments. In this case, there are many more articles with upvotes than comments. Therefore, what is interesting about his finding is the lack of correlation between the number of comments and upvotes for articles with high number of views.
We all want to hit those high number of views for the content we share on inbound.org. In our endeavor to do so we need to take into consideration the fact that there isn’t a correlation between the comments and upvotes and each of these metrics alone is not an indicator of success.
FINDING #18 There is No Correlation Between Views and Upvotes on inbound.org
We would also expect to be a correlation between the number of comments, views and upvotes, especially for the most engaging pieces of content. However, we realized that there isn’t a correlation between the metrics we’ve just mentioned.
We took for analysis all the pieces of content with more than 100 comments, as we considered that this would be representative for “engaging content”. If initially we thought that this type of content would present a sort of linearity if not exponential growth, looking at the charts below we realized that there isn’t really a correlation between the number of comments, upvotes and views.
For instance, most articles with over 100 comments have between 101-200 upvotes and a maximum of 50 k views. There are only a few articles with more than 10k views, 100 comments and 500 upvotes. We would have expect an exponential growth, yet, this doesn’t seem to happen.
FINDING #19 The Number of Comments is a Strong Indicator for Getting High Karma Points on inbound.org
We cannot define what a lot of karma points would really mean. If we’d say that 500 is a good karma to have, in comparison with Mary Green’s 70 000 karma points (score that she had on 04/13), our score doesn’t look so impressive. If we’d take members with karma over 5000 for analysis, the difference between this number and the negative karma scores that some of the members have would be even greater.
Therefore, we were curious to see how active in terms of shares, upvotes and comments are the members with karma over 1,000.
As you can see in the screenshot below, the members’ description includes the number of upvotes, comments and shares.

As we analyzed all the metrics mentioned before for all the members with karma over 1000, we realized that a high number of comments is a strong specificity for this category of members. The highest numbers from the chart below are the ones representing comments. The number of upvotes and shares is also pretty large, yet, it doesn’t overcome the number of comments. What is interesting to notice is that the number of upvotes and shares go side by side for almost all the intervals. Therefore, it seems like the number of comments is a stronger indicator for high karma points as most of the members with over 1000 karma points can be found in the category with members who left over 500 comments.
Conclusion
With this current inbound.org analysis we’ve tried to highlight the most important findings that might interest any digital marketer, be it a noob or a savvy. Most of the findings were concentrated on two directions : the content and the members. Therefore, let’s review the most important findings taking into consideration these two paths.
Regarding the content published on inbound.org:
- The quantity of content published on inbound.org is really impressive. However, quantity matter but not as much as quality. The good news is that there is a lot of content that generated lots of traction on inbound.org, from which we can conclude that there is lot of qualitative content out there.
- The bad news (although it’s not really a bad news) is that we don’t have a direct indicator of success for the posted content. It seems that there isn’t a direct correlation between the number of comments, views and upvotes. Not to say that none of these “vanity” metrics alone is a success barometer. Therefore, when you look at an article on inbound.org with lots of upvotes for instance, don’t think that automatically has a high number of comments and views as well. Also, when posting content on inbound.org, don’t aim for upvotes only but try to generate traction and make people discuss about your article.
- It seems that the best time to post your content on inbound.org is at the begining of the week. Also, SEO related articles are the one that interest the user most, along (or including) Google related matters and AMA discussions.
- 90% of the total content is represented by external links. However, discussions, although in a significant smaller number, manage to get high number of views and comments.
Regarding the inbound.org community:
- If we were to make a generalization, we’d say that inbound.org members are pretty active and have about average marketing knowledge.
- Despite the fact that more than half of all users have never left a single comment, the total numbers of comments posted on inbound.org (107,581) reiterates the fact that is a very active community we are talking about.
- Half of the members come from US, have management position and are “SEO oriented”. When it comes to favorites tools or blogs, SEO related ones are the one mentioned.
- An interesting particularity of this community is the fact that its members are not big “fans” of following other members. For instance, 80% of all users don’t have a single follower. There are is only a small percentage of members who have a big number of followers.
- When it comes to karma, things are somehow similar. There is a small percentage of members (from which well-known people from the digital marketing industry) who have impressive karma scores. While Karma doesn’t usually come with very tangible advantages, it can help with visibility in certain contexts. It also seems that the number of comments can be an indicator for karma points: More comments bring more karma points.
- The people with the most highly-rated articles weren’t always the people with the all-time highest-rated article. This suggests that being consistently good is more important that being sometimes the best. Conversely, some of the people with the all-time highest-rated articles weren’t found in the people with the most highly-rated articles. This makes it quite obvious that success is a long distance game and not a spur-of-the moment fling.
Along with the in-depth content data exposed, what this analysis manages to do, is to highlight the understated and often ignored power of the influencers – people belonging to a community who have a significant influence over the beliefs and actions of their peers, without being official leaders. This means that they represent a category of people with tremendous appeal for marketing. It also means most marketers ignore what makes them special and fail to persuade them. This is because the things that make them influential also make them more resistant to being easily influenced. So what are some of their characteristics and what can we learn from them?
Influencers are today’s unofficial gatekeepers of information. Although they don’t have discretionary power over what gets read and shared, they are an essential piece of what makes a piece of information “newsworthy”. It’s exactly because of this that we need to make sure our content is worthy to begin with. If we do our job well enough, gaining the “news” prefix might no longer be a game of chance, but of playing to your and other people’s strengths.
Who did this research
 Razvan Gavrilas Researched & Audited the Analysis
- Cornelia Cozmiuc Researched & Wrote the Paper
- Ionut Astratiei Performed the Crawlings
and Data Validations
 Razvan Gavrilas
  Cornelia Cozmiuc
  Ionut Astratiei


Wow, what an in depth article. I only just reviewed the highlights. There is a lot to digest. The mix in my world is quantity and quality. Not always easy to achieve.
I really never really measure comments as an important factor these days, especially since so much commenting is done on social platforms.
Rosh
That is a ton of data. Nice job analyzing it.
Like most sites, upvotes is key.
Great work & article Razvan, thanks for sharing these findings! I found inbound.org to be an excellent source of topics for my articles, as well as a great place to find like-minded people for interviews and guest articles. To me, it’s one of the best communities for online marketers.
Oh wow! So much of information and insights. How you managed to get so in-depth info? I would love to know. Truly amazing.
I would love see more of the similar in-depth research from SEOCognitive team. You should come up with a case study in Harvard Business Review.