 Site Explorer
 Keyword tool
 Google Algorithm Changes
Long content or short content? Which one is better? What is the case? The more the merrier, or less is more? Well, the answer is rather complicated and needs a bit of unpacking. If you are looking for a short answer you need to know that there is no such thing. Long and short content alike can be better, depending on the context and on your needs: rankings, conversions, followers, popularity, authority, engagement, keyword optimization, etc.
TL;DR – This is quite a large study. If you don’t have time to read it all, you can browse through the main take-aways.
![]()
- How We Did the Research & Other Relevant Studies
- Shorter Articles Are Better Correlated With Higher Ranks.
- Micro-content – As Long As You Are Around the 23-Word Mark You Are on Solid Ground.
- Short-Form Content- Try to Stay Within the “golden” interval: 317-327 words .
- Medium-Form Content- The Higher the Number of Words, the More Likely a Post Will be on a Lower Rank.
- Long-Form Content- Longer Posts Are More Often Associated With Better Ranks.
- Scientific Form: There Is More to Gain by Making Your Content “The Shorter” of Long Articles.
- How the Google Search Console Will Help You Choose Between Long or Short Content.
- Long or Short Form Content – Which One Has More Impact?
- Conclusion
How We Did the Research & Other Relevant Studies
There’s an often cited quote attributed to Blaise Pascal (and a variation of it attributed to Mark Twain) in reference to a letter:
I have made this longer than usual because I have not had time to make it shorter.
Pithiness aside, the quote is a very good illustration of how saying more with fewer words is not only more rewarding, but can also take a lot more effort and time.
Therefore, in order to decide the winner, long or short content form, first we should ask ourselves what our goal is and only afterwards decide. Yet, we’ve made this decision a bit easier for you as we’ve conducted a very in-depth study on approximately 300k pieces of content, randomly chosen, that rank on Google on positions 1 to 10. We’ve used the Pearson correlation coefficient to take the best out of the aggregated data.
We wouldn’t want to bore you with technical details of the research, yet, please allow us to motivate this current research. Except the fact that we always want to keep our readers up to date with the latest findings in the digital marketing area, documented and written by ourselves, we found this study really necessary. There aren’t recent studies (or at least we didn’t find any) on this matter and in a digital marketing world where “content” is a term so widely circulated we felt the need of a in-depth study that could reveal what type of content is helpful and why. There are some interesting studies on this matter, yet they are from almost two years ago.
The results of this study will definitely help you figure out what type of content strategy would work for you and why. Without further introduction, I’ll let you grab a big cup of coffee and a notepad as you might want to note things down.
Long or Short content – Which One Is the Winner in Terms of Rankings?
Long or short? Which type of content is the winner? Well, if you’re looking for a brief glimpse, the chart below is a pretty accurate visual representation of the answer. It’s not a perfectly linear relationship, although there are some clear linear segments. At least for the first 5 rank positions, one could assume that, on average, shorter articles are better correlated with a higher rank.
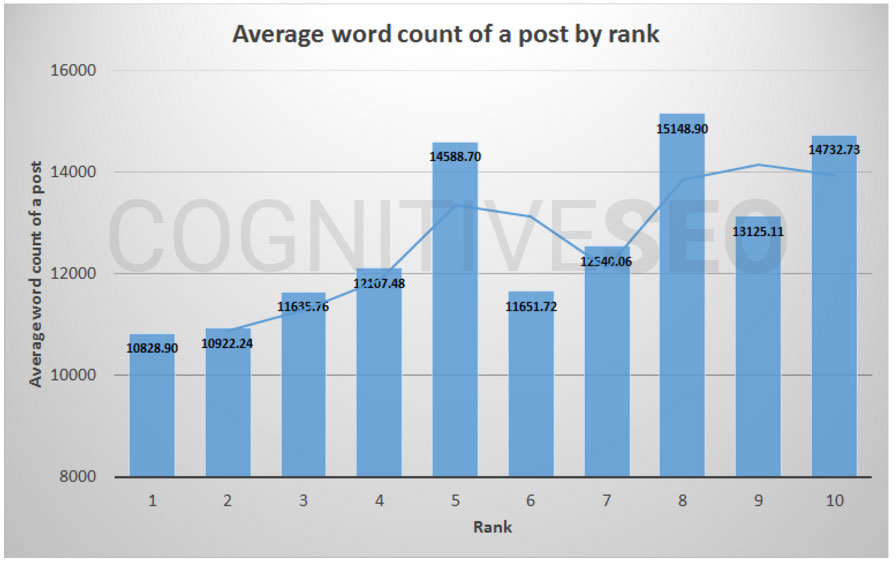
It would be, of course, inaccurate to infer from here that posting shorter articles than your competitors will get you higher up through the rankings. Not just because the data for ranks 6 through seem to invalidate this conclusion, but also because “short” and “long” are not clearly defined. For instance, should you prefer a 20-words article over a 1.000-words article? Intuitive judgment would say that doesn’t seem to make sense.
In fact, in order to be able to draw a valid conclusion from the data analysis, we should first break it down into categories. Which is what we did, by looking at clusters of articles, based on ranges for certain lengths: 0 words, 1-50 words, 51-100 words, 101-500 words, 501-1000 words, 1001-5000 words, 5001-10000 words, 10001-100000 words and >100000 words. What does the landscape look like when divided like this?
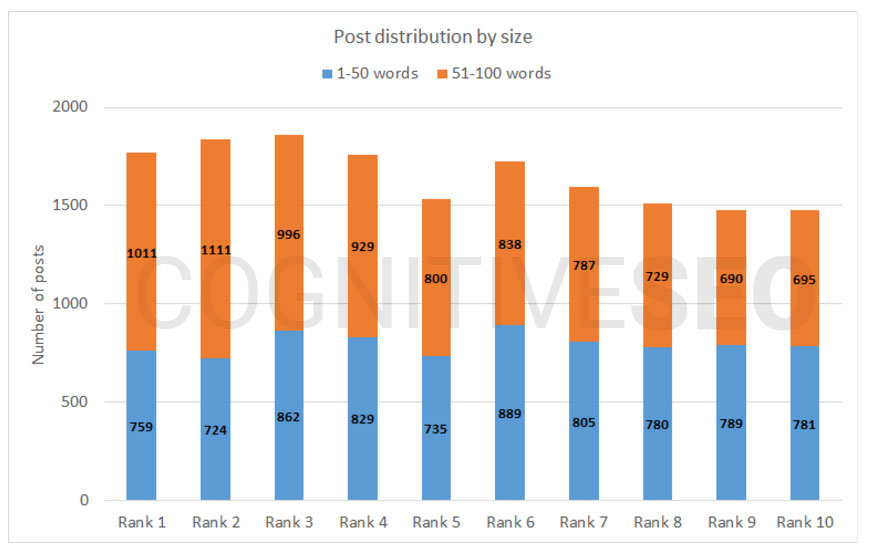
We can look at these two post size intervals (measured by number of words) as a somewhat special case. A hundred words is not a lot of space to detail a topic, so for all intents and purposes, these posts are likely to fall under specific categories (social network updates, for instance, are known for their brevity, whether it is sought after or ingrained in their design).
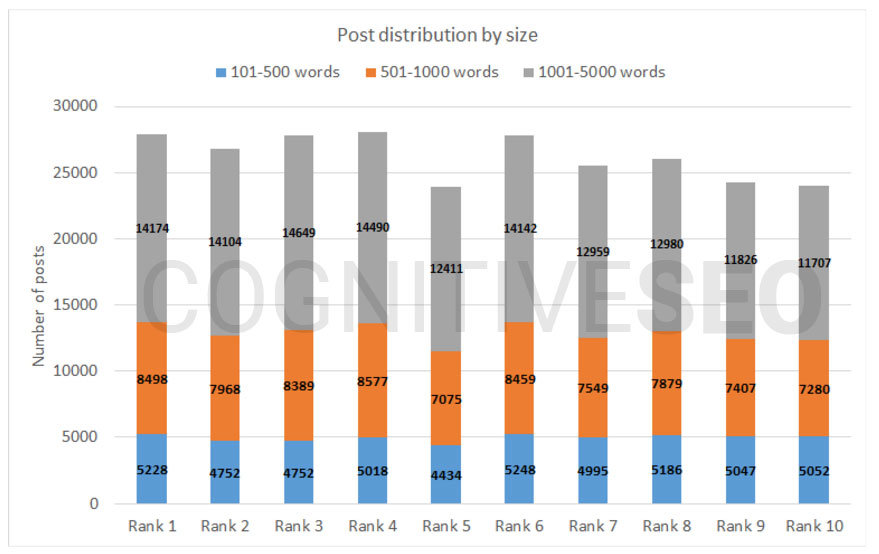
This is, without a doubt, the bulk of the content. Mid-size to long-form posts, they allow for at-length development of a topic. It could be news, opinion or analysis – either way, there’s a high chance we’re dealing with quality posts.
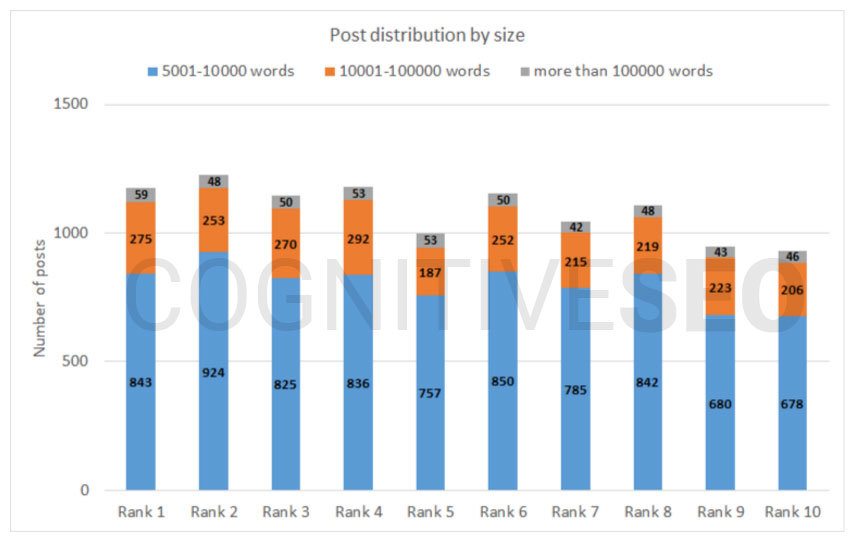
This is, again, a special area. Posts that go beyond 5.000 words are rare and the more they increase in size, the rarer they get. Some of these posts could fit comfortably into a magazine, while others have a size that’s comparable to a thesis or dissertation.
As you’d expect, most articles are between 100 and 5.000 words. There is a very small percentage of articles under 100 words (just over 5%) and a very small amount of articles over 5.000 words (a mere 3.5%). So even though we’ll look at most of these ranges, we’re mainly interested in the ones that represent the largest percentage of the data.
So let’s first take care of the edges. Articles with over 10.000 words are articles that are rare enough (both in size and content quality) that would probably warrant a separate discussion (in fact, most BA or MA thesis are between 10.000 and 100.000 words and most doctoral dissertations are limited to around 100.000 words or less, so any blog post that’s larger than that has earned a separate analysis).
We’ll begin, then, with articles which range from 1 to 50 words. In fact, before you take a closer look at the chart below, bear in mind that this paragraph fits in this range, by summing up exactly 40 words.
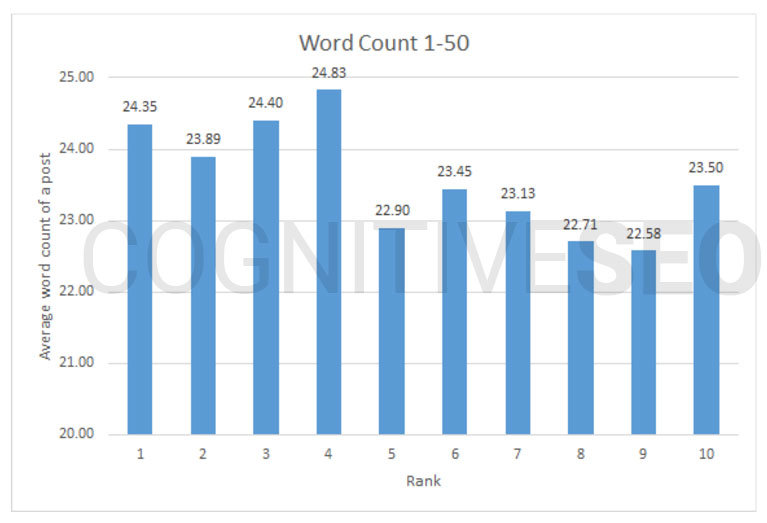
So if this is the size of content that we’re talking about, it’s no wonder that a conclusion is hard to make. We’re basically looking at micro-content here. Facebook posts, Google+ headlines – this is what can ideally fit within this range. A conclusion about what works best is difficult to make, because there’s very little variation (a 2.25 range between the lowest and highest value) and all average values are within less than 2 words away from the median value across all ranks.
Basically, this is a very even playing-field and as long as you are around the 23-word mark (give or take), you are on solid ground. Incidentally, that sweet spot is also the middle of the overall interval, but given what the interval is, that’s likely to be a coincidence rather than something to read into. The Pearson Correlation Coefficient between the average length and the rank is medium to strong (-0.71), indicating a potential negative correlation. And if we are to ignore some hiccups in the chart, it sounds about right: a slightly higher number of words might be better. But then again, if you have to choose between a 22-word title and a 25-word title… that’s probably not where the ranking difference will come from.
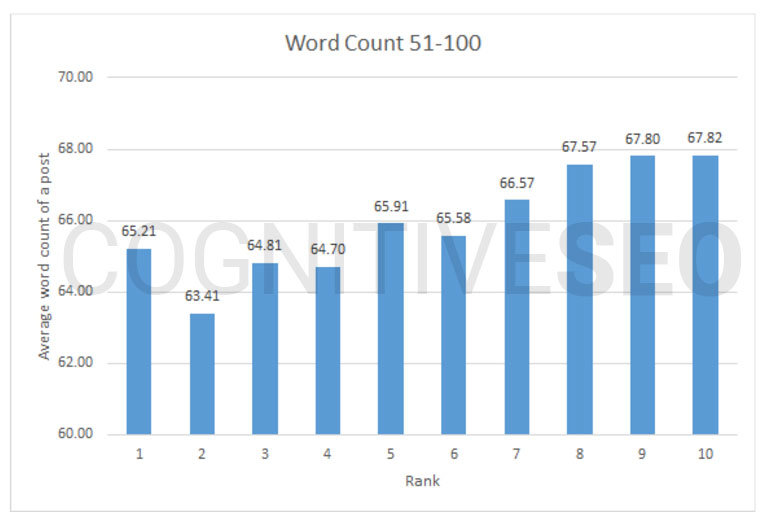
Tweets and title tags are considered among the prime examples of content that can fit comfortably within this range. Compared to the previous interval, you can notice a much smoother trend (if you ignore the first 3 ranks, it’s actually a fairly linear trend). It makes sense in context, too. Tweets and title tags, on the other hand, are already short by design, so if you want to compete with others the only way to stand out is to make them no longer than they need to be. There’s another good indicator that shorter is better. Median and mode are the same (56), but they’re both lower than the average, suggesting that there’s actually a lot more instances of fewer words rather than more words. The Pearson Correlation Coefficient between the average length and the rank is really strong for this interval, at 0.9, proof of a linear positive correlation: higher values (for number of words) are associated with higher ranks.
Of course, things are still pretty close. The range for the averages is 4.41 (corresponding roughly to a 7% variation), so there are probably other things at work to take into account. But so far, this is the first significant relationship that we’ve seen.
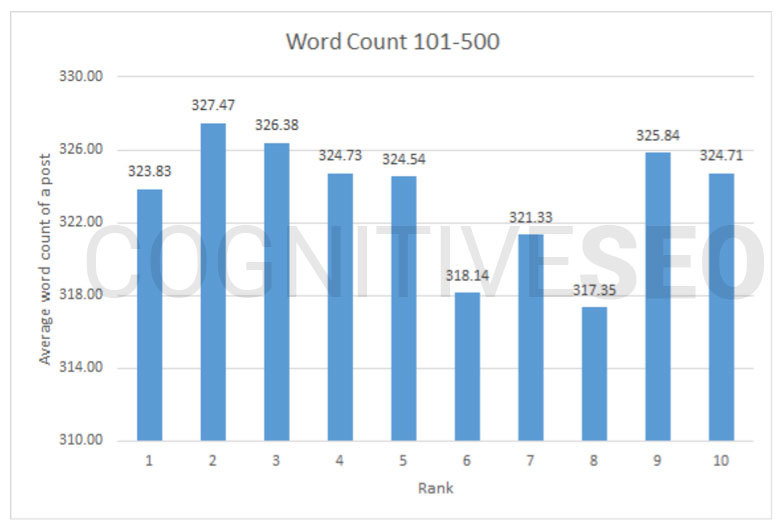
It’s difficult to tell what type of content might fit in well within this range (small stories? teasers? news?) It’s also difficult to draw conclusions based on the chart. The Pearson Correlation Coefficient would normally imply that there is a small negative correlation (-0.35) between average word length and rank. This can be roughly translated into saying that slightly longer content seems to be ranked higher, but that this does not happen uniformly across the 10 ranks. Not only is the average for the 1st ranked content lower than for the 2nd and the 3rd, but the average for the 6th and 8th is also lower than the one for the 9th and 10th.
This is where it’s probably helpful to notice that the range of values only covers 10.12 words (so a mere 3% variation between average lengths) and that the median value is 333, slightly higher than but also fairly close to pretty much all of the averages in the above chart. We’ve seen this before with the 1-50 word interval and the conclusion is similar: as long as you’re within the “golden” interval (which, in this case, seems to be 317-327), there’s isn’t any really good advice in terms of length.
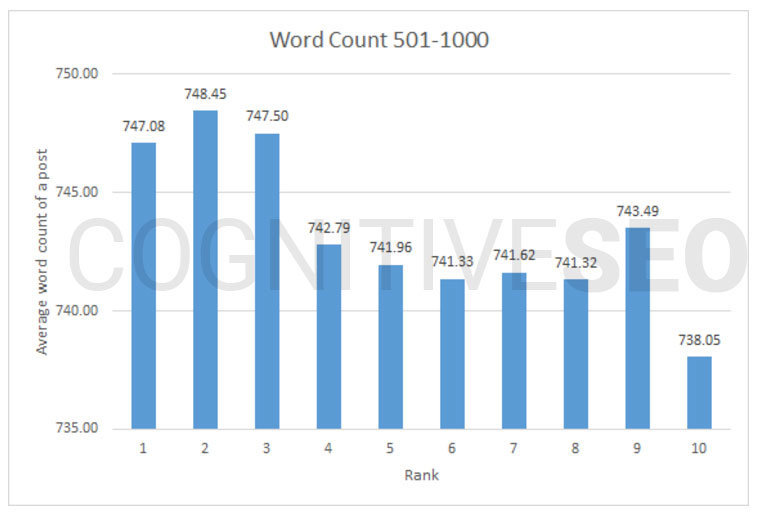
It might no longer be the case nowadays, but conventional wisdom used to be that most newspaper columns had to fit within 500 to 700 words. Which means that we’ve already entered quality, in-depth posting territory. Of course, not all of the content in this word range is automatically good, but it has the potential to be. It shouldn’t be a surprise, then, that overall a higher number of words seems to be correlated with a better rank. This is supported not only by the graph, but also by the The Pearson Correlation Coefficient, which seems to indicate a strong negative correlation (-0.84) between post length and ranking (meaning that the higher the number of words, the more likely a post will be on a lower rank).
Of course, it’s not a perfectly smooth linear relationship. There’s a visible aberration from the rule for the 1st and 9th rank. The range of average values is not very big, just 10.4 between the largest and smallest average word count among all intervals. That’s less than 1.5% compared to the smallest average word count value. Still, even when taking all of this into account, this is the strongest linear relationship we’ve seen, next to the one for the 51-100 interval.
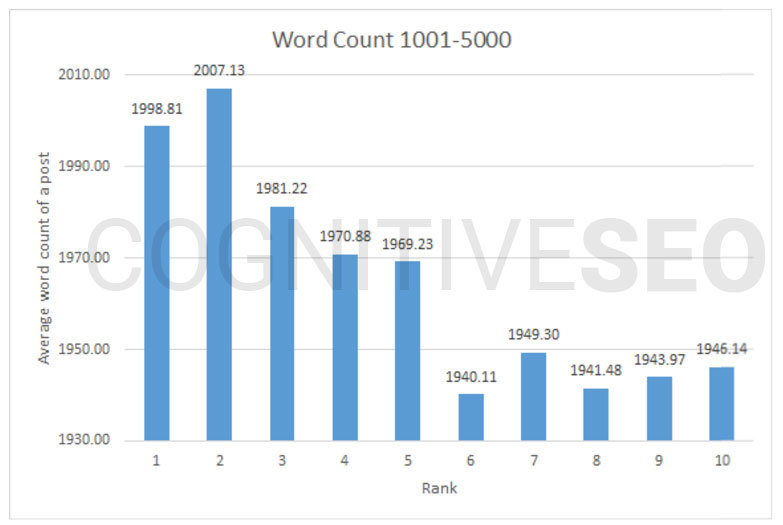
Longform articles are alive and well. Some of the most successful news stories from New York Times in 2013 averaged around 2000 words, with some being much longer than that. Even online, where space is not an issue, the ideal blog post revolves in this interval, at around 1600 words. It’s no surprise then, that slightly bigger seems to be slightly better. Even though the chart shows a slightly more bumpy trend line, the Pearson Correlation Coefficient indicates a very strong negative correlation (-0.9), suggesting that, in general, longer posts are more often associated with better ranks. Sure, that trend might be more difficult to support for the second half of the rankings, but the difference between the first and second 5 rankings is so striking that it’s difficult not to see a correlation.
Some other things seem to support the correlation hypothesis as well. The range is 67.02 (3.4% of the smallest value), quite bigger than for the previous word count interval. The median is 1672, significantly lower than all of the average word count scores, meaning the first five ranks probably have posts that are quite a bit longer than the last five ranks (in order to compensate for the difference between the median and the average).
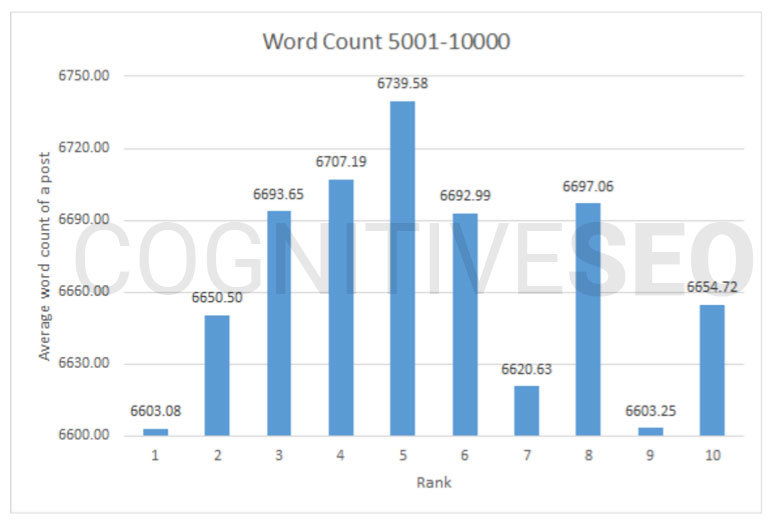
Most scientific papers are usually between 3.000 and 10.000 words in length. This could mean up to 20-something pages of text with no pictures. Even if it’s not a rigorous scientific paper, it’s easy to understand why the success of such a post has less to do with its length (as can be implied from the chart) than with its quality. Of course, shorter might still be better if we were to look at just the first 5 ranks, but not because of the length itself (the effort is already considerable for the reader even at 5.000 words), but because the struggle for conciseness tends to make everyone’s output a little better.
All of this aside, however, it’s important to bear in mind that the range of word lengths is still very small when compared to the average length. The difference between the highest value (6738.58 for the 5th rank) and the lowest one (6603.08 for the 1st rank) is just 135.5, only 2% of the smallest average length. Taking everything into account, the lesson here would probably be that if your content is really long, there’s probably more to gain by making it the shorter of long articles.
How the Google Search Console Help You Choose Between Long or Short Content
Depending on the context, and on the needs, long or short might be suitable in different circumstances. Yet, whatever your needs might be, one thing is sure: more content means more keywords to rank for. And allow me to explain you why.
It’s not just that stories that take their time to build up content are better, they’re also pragmatically more likely to make you relevant. Using Google Console you can find out what type of content makes you rank for what keywords. And obviously, the longer the content, the more keywords to rank for. Simply add the URL of the post you’re interested in and you can see statistics about who has accessed it and why (what they were looking for). It might give you a lot of insight into what people are looking for and how they think.
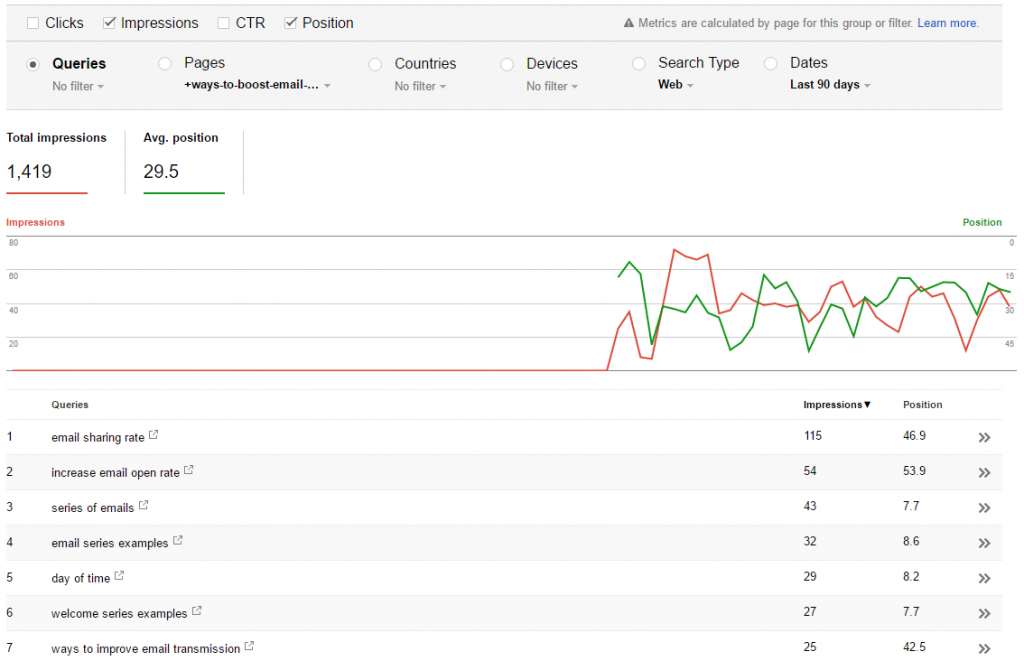
Let’s take for instance one of our articles: 53 untapped ways to boost your email open rates. Once we’ve inspected this article using Google Search Console we’ve discovered some really useful data. First of all, being a long piece of content (over 10.000 words) is ranking for so many keywords. Secondly, we can find so many ranking possibilities for this article. Along with the positions info you can find data regarding the number of impressions.
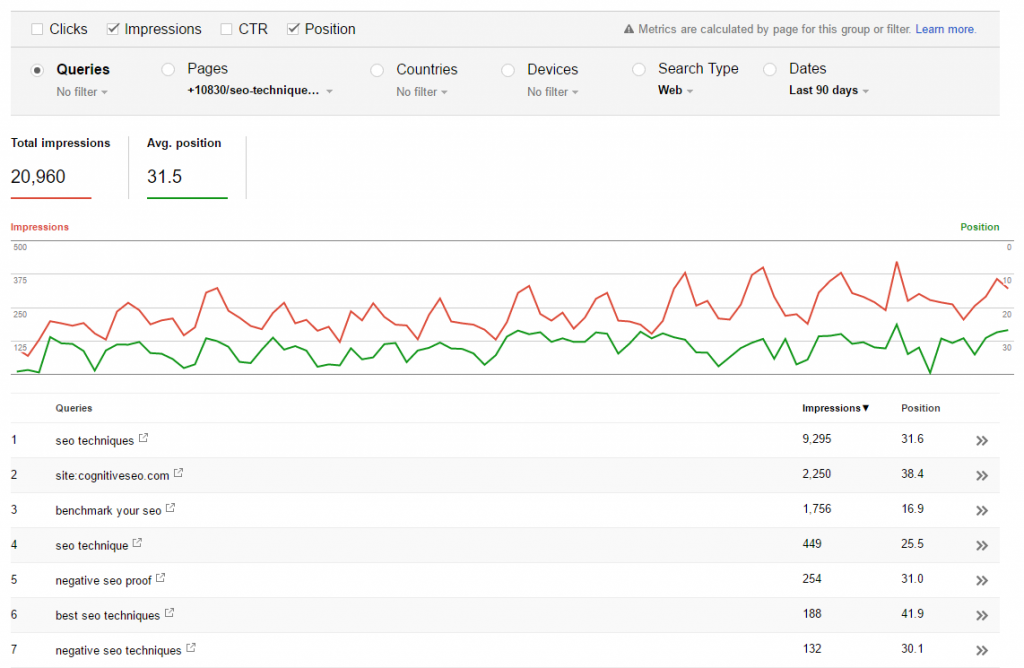
More keywords to rank for, more help in figuring out what type of content is working and which one is not. We did the same type of analysis with another article from our blog, 39 rarely used SEO techniques that will double your traffic. This article was a successful one, generating a lot of shares and comments. Along with this metrics, we were able to see the most “valuable” keywords for our article.
Using Google Search Console to determine which type of content, long or short, is working for you might be a great and still unexploited idea. The benefits are great and the effort invested is minimum.
Long Content or Short Content – Which One Has More Impact?
We’ve already warned you that the answer is not that easy. But what if we were forced to decide? Here’s what the conclusion might look like:
- Micro-content (1-50 words): you are limited by design, so you might as well take advantage of the wider spectrum, though it might be more important to fit within a certain range, rather than to be on a certain end of the spectrum;
- Micro-content (51-100 words): you are in a slightly different scenario; you are still limited by design, but you’ve crossed into territory where you can afford to be sparse (your limitations are more accommodating, so now you get to fight for attention – and attention span);
- Short-form content (101-500 words): length is probably less relevant than content; admittedly, a 150-word post is quite a bit different from a 450-word post, but they both have in common that they’re either too long or too short for what you want to communicate;
- Medium-form content (501-1000 words): the avenue of traditional newspaper columnists, there’s still power in this format; you actually have a pretty good chance of being able to provide your readers with useful, well-argued analysis on a subject, or at the very least with a well-informed opinion, so you might as well push it a little and get in more words, rather than fewer, if that allows you to be more persuasive;
- Long-form content (1001-5.000 words): you’re in the big leagues now and if you can craft a post that holds your readers’ attention for long enough, don’t be quick to finish; your readers already know they’re in for the long run, so take your time (and words) to provide more in-depth analysis, more examples or just more clarity;
- Scientific form (5.001-10.000 words): not all posts this long are necessarily scientific, but that’s probably the best analogy in terms of length; shorter is probably better, but shortness does not guarantee better results;
- Exceptions with more than 10.000 words: you’re not in Kansas anymore, Toto; we did not go into analysis with this word count because it’s quite difficult to ascertain what kind of content might go here; even so, once you reach this size, any differences in length are probably not going to have significant impact on how you rank (though if we were to venture a guess based on Pearson’s correlation coefficient, shorter is better).
Conclusion
The fact that the most widespread form in our analysis were actually long-form articles is no coincidence, since in-depth analysis seems to perform well consistently regardless of the source . Long-form allows you to run analyses (like the ones we’re usually posting), discuss case studies in detail and generally come up with original content. Shorter content (such as lists, news and examples) are fine, too and still necessary, they’ll even get you shares, but a lot of times short-form content is just re-hashing of original long-form content . Some of the most shared stories in 2015 are not what you’d expect at all: endangered species, screen addiction, walking in nature, Kenya’s elephants, etc. Sure, a lot of what you see as “viral” are lists and clickbait and kittens, but there’s still a lot of interest for quality content, too. You can’t get ahead by doing what everyone else is doing (or sharing). You need to create your own share-able content and that takes time and length.
Who did this research
 Razvan Gavrilas Researched & Audited the Analysis
- Cornelia Cozmiuc Researched & Wrote the Paper
- Ionut Astratiei Performed the Crawlings
and Data Validations
 Razvan Gavrilas
  Cornelia Cozmiuc
  Ionut Astratiei


at my point of view, quality content always stands. but a descriptive content can help the readers to understand better.
Something to consider – I wonder if a lot of those 1-50 word posts that ranked highly had a large number of images or video(s) on them as well. Google surely takes content other than text into consideration as well, so saying that a post “with only 25 words” is ranking highly is somewhat misleading.
Just a thought!
I thing my blog cocktailmarianne .com was affected by Penguin update http://imgur.com/a/iX39R
If I keep add more content on my blog is a solutions?
Hi, Marianne!
Indeed, a new Penguin update has just been rolled out. I think that this blogpost might interest you: https://cognitiveseo.com/blog/10409/google-penguin-4-0-released/
For me the whole discussion boils down to the point: go for short content if you want to keep your blog fresh by posting frequently and go for long content if you are contributing a guest post once in a month.
Thanks for your contribution, Adwait! Your “formula” might be a successful one 🙂
I believe content is still an important factor in ranking a website. Websites with more than 2000 words on the homepage will be ranked higher than a website with a lower number of words. Of course, this should not be ruined with keyword stuffing in content.
Agree on this one, content is a very important ranking factor.
I think that first of all our content should be interesting and helpful for readers. Of course we should consider the requirements of the platform, on which we are going to place it. But if you have less to say, then don’t inflate your content like a balloon. We should be able to stop in time.
Alexis, great point; the length of the content should of course be influenced by the platform’s requirements.
Sometimes people skip long content as per my point of view write enough and interesting content usually people don’t like to read more they just want to see the answer of their search query
Indeed, Radhe! Nowadays people don’t tend to read long content. Yet, I believe that it also depends on the things they are looking for, their interest in a matter.
Google has a mind of its own – keywords are ranked on no particular generic methodology. Likewise, there is no general format for optimisation. SEO requires on-the-toes work-flow.
Both can be better it just depends how you convey the details so that the person reading can somehow be interested..
We always use 1,500+ words for a locally optimized website. For affiliate websites a minimum of 6,000 words.
Yes, there are websites ranking well with a less amount of content, but in our opinion, it’s hard to “overdue” content on a website.
Perfect explanation for content writing. It have always been a problem for every website holder to rank higher with use of long and short content. keep the good work going
I usually have a rule that if the content is designed for Google ranking then 1800 words is the aim. If the content is purely for social media then the length can vary to best suit the audience.
Thank you for sharing those graphs! I personally like to switch up the word count lengths for my website content. I think it looks more natural to Google when website content is not all the exact word count. For example, some articles I have written are 750 words, some are 1000 and some are 2000. In my opinion, varying the lengths of your website content is an important factor in receiving high Google rankings.