 Site Explorer
 Keyword tool
 Google Algorithm Changes
You know how important online presence is to any business and how valuable it is to deliver performance. But how well do you understand your users’ path and what makes them engaged? How often has it happened to you to find out specific things about your traffic and make correlations but didn’t know the steps for filtering your data?
Understanding your Google Analytics results can be hard and tricky, but Google Analytics Insights is the everyday solution. It’s like training for the race and come home with the medals.

The great side of GA insights is the personalized list of marketing tips and tricks you get based on the activity of your business. It uses a machine learning algorithm, named Analytics Intelligence, which makes it easier for the business owner to discover what’s important in the pile of data and then take meaningful action. And the best thing of all is that you can ask questions and get directions.
- Understand Year over Year Growth of Average Order Value
- Know What Users Are Interested in Purchasing Right Now
- Keep Your Loyal Users Engaged
- Find Any Anomalies for Your Website
- Find the Landing Pages with the Worst Ecommerce Conversion Rate
- Track the Revenue Trend for Your Products/Services
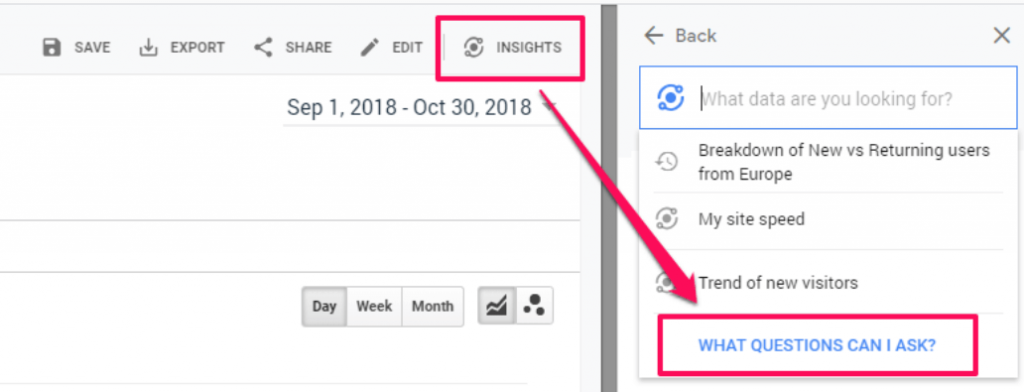
Google Analytics Insights offers great guidelines for your website. For starters, you can select some questions from a standard list to get some directions. Straight form the Insights go to list of questions regarding users, traffic trends, content analysis, users behavior, product performance and technical performance.
Creating great campaigns and improving your digital marketing results is mandatory for success, that’s why you should keep an eye on Google reports for insights. While Google Analytics gives you performance insights, platforms like ViewMetrics Analytics take it a step further by consolidating and visualizing multi-channel marketing data in one dashboard.
1. Year over Year Growth of Average Order Value
For e-commerce websites, Average Order Value (AOV) is one of the most important metrics that should be tracked. It a metric that measures the total average of all the transactions made by a customer each time they place an order on the website, within a specific period of time.
AOV is determined by measuring sales per order, not sales per customer. Although one customer may come back multiple times to make a purchase, each order would be counted separately in the AOV.
| Keeping track of Average Order Value would help business owners to be aware of key business decisions such as advertising spend, store layout, and product pricing. | |
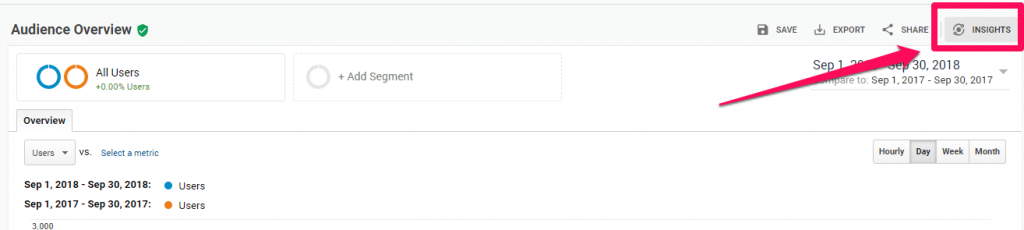
To find out the year over year growth of AOV you need to go to insights. You can access it from all the google analytics dashboards; it doesn’t matter where you are.
Then, you can search for “year over year growth of Average Order Value” or go to Conversions » Ecommerce » Overview. There you can see something similar to the next graphic.
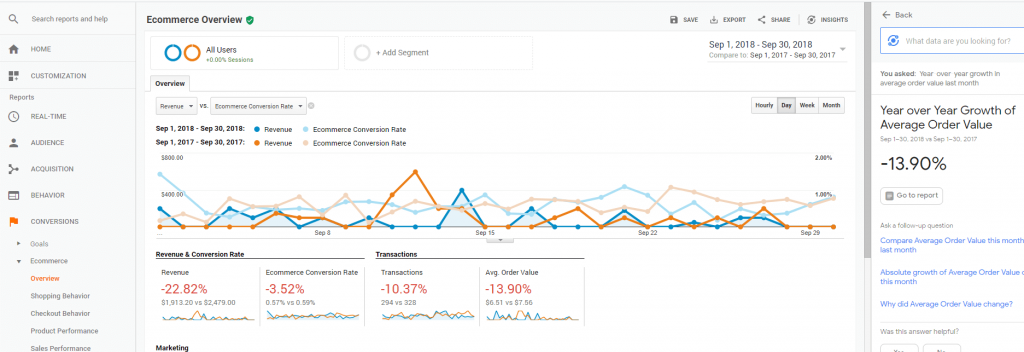
You can see if your AOV has increased or suffered a drop. In the first case, a higher AOV will increase your ecommerce store’s profitability. In the last case, it means that this year’s orders (according to the graphic, it is 2018) are fewer than the ones from the previous year (2017).
You can increase the AOV by a few improvements/tricks in your selling process, such as:
- Offer free shipping. There are lots of websites that offer free shipping with regard to the period of shipment.
- Offer limited free shipping for a specific order value. For example, chose a free shipping value of $25 or $30 depending on what type of products you sell. If you’re selling luxury products, unfortunately that doesn’t apply.
- Offer additional products right in the card after the customer placed a product. If you give recommendations based on what the customer ordered, you might encourage additional spending
- Give coupons to loyal customers to inspire them to make purchases.
- Start a loyalty program. You can create fidelity cards with points and for each purchase, the customer can collect points.
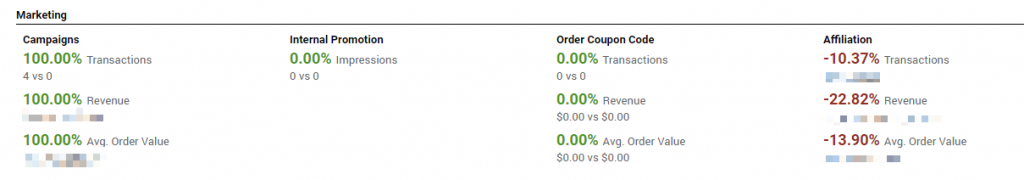
The beautiful side of this Overview panel form Analytics is the Marketing section, where you can see what campaigns are performing in terms of transactions, revenue, and AOV. You can see here what online marketing strategy (promotion, coupon codes, affiliation) works best:
2. Know What Users Are Interested in Purchasing Right Now
If you want to know who is interested in buying right now from the whole list of leads, then In-Market Segments is the choice you should make. In-Market Segments reflect the users who are interested in a product and close to converting. They can help you decide what to promote or how to remarket.
Simply click on Insights and search for “Know what users are interested in purchasing right now” and you’ll see a similar report for your website:
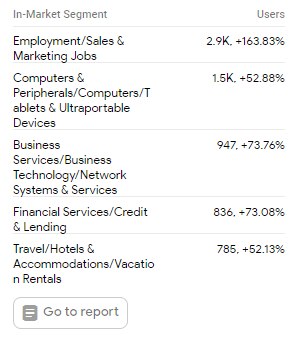
In the screenshot above, you can see the In-Market Segments for Aug 1, 2018-Aug 31, 2018. And if you look at the number, you can see that they have grown significantly over the past month. By clicking on Go to Reports from your Google Analytics Account, you will be redirected to Audience » Interests » In-Market Segments.
Here you can create segments and keep track of what you’re interested in. This way you have an easy management and a clear sight of who is more active and who needs a little help. You can see Google Analytics data regarding behavior, e-commerce conversions or goals completition.
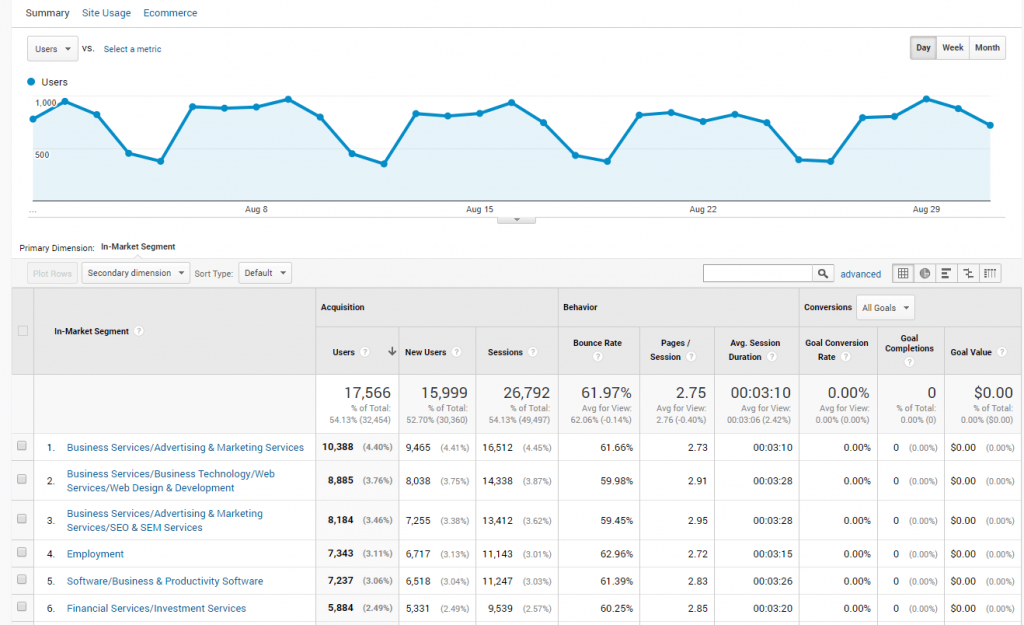
Based on the results above you can use remarketing, and focus your lower-funnel marketing (e.g., promotions, discounts, product bundles) on these users. For example, create audiences with conditions like “In-Market Segment exactly matches Financial Services/Investment Services”. You can then use these audiences in AdWords, DoubleClick Bid Manager, or DoubleClick Search remarketing campaigns.
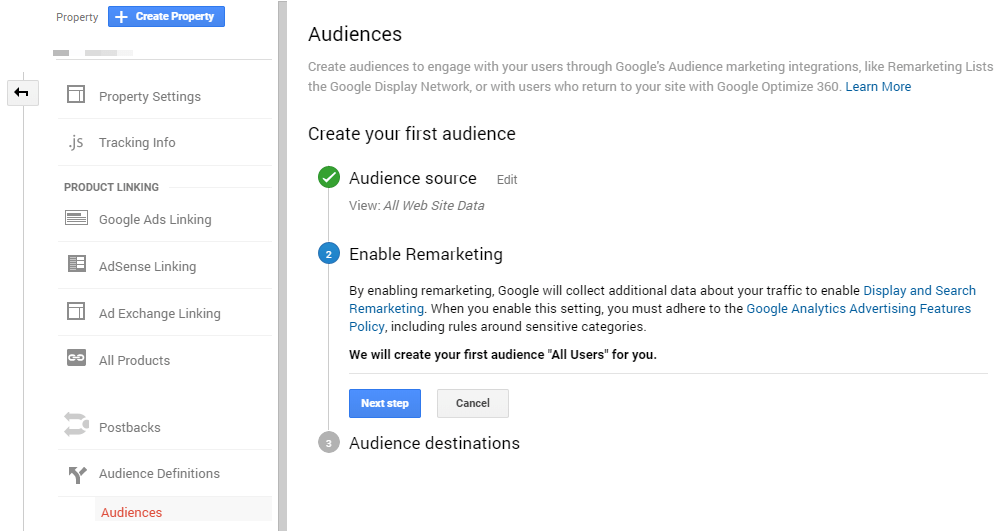
If you want to create audiences, you have to go to your Admin panel » Property » » Audience Definitions » Audiences.
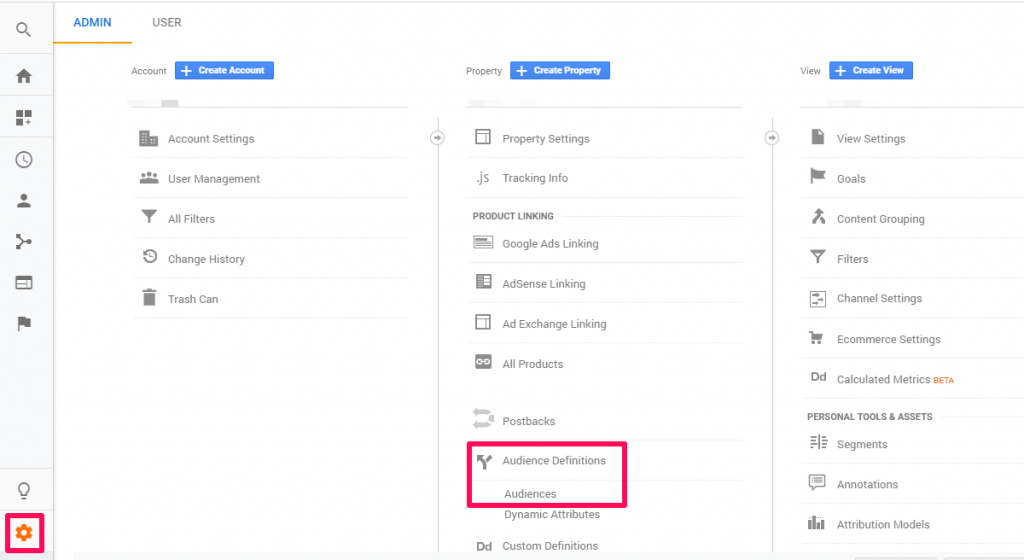
After you select Audiences, you can set up the steps for Remarketing and create your first audience.
3. Keep Your Loyal Users Engaged
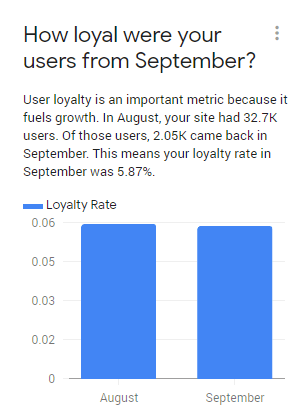
Loyal customers are hard to achieve and once you gained their hearts you must keep their engagement rate high. If you want to see the percentage of loyal users, you can search for “How loyal were your users from September?” in the GA insights section.
On the site we analyzed we could see that the loyality rate was 5.87% in September compared to August.
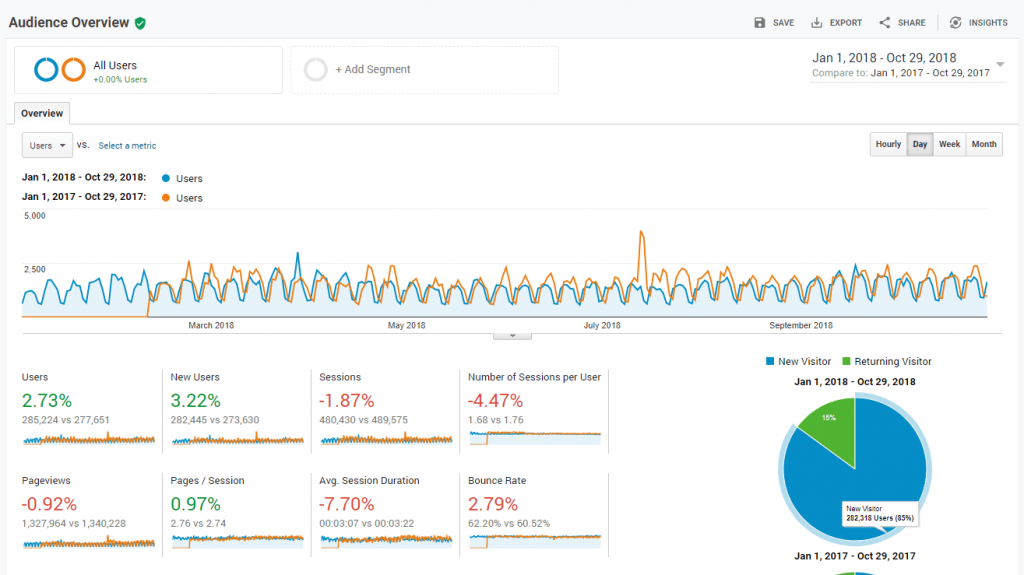
To follow up on these numbers, you can see the exact number or users if you go to Audience » Behaviour » New vs. Returning and select the last 28 days or check the monthly trend of users over the last 12 months.
You can always compare these results with the previous year and for that you have to look at the year over year growth of users. For the analyzed site, we have an increase of 4.11%.
In case there was a decrease there are some things to consider, such as adding new site features, product strategies, or marketing activities.
4. Find Any Anomalies for Your Website
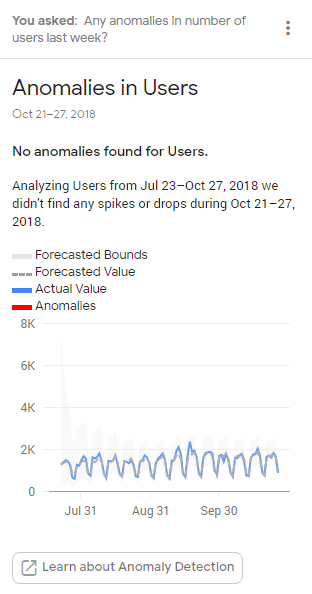
If you think something strange happened to your users or your website, you can search to see if there were any anomalies in users, sessions, impressions, transactions and more. Google uses a specific model – Bayesian state space-time series model – to forecast values that stand out beyond the normal trend in the time series data:
| Analytics Intelligence Anomaly Detection is a statistical technique to identify “outliers” in time-series data for a given dimension value or metric. | |
Go to Google Analytics Insights and search for “Any anomalies in the number of users last week?” and your question will be answered. For the website we analyzed we can see there is nothing abnormal regarding users.
There are two types of anomalies presented in Google Analytics:
- for sites that experience a spike;
- for sites that had a drop in sales or some metrics perform poorly.
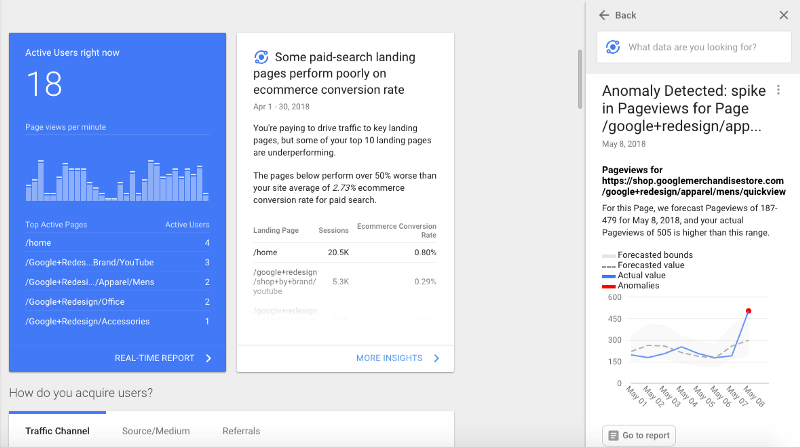
In case you find anomalies in your account that signal some negative performance, then you should look at the results and the period of time. As you can see in the screenshot below, Google detected 1 anomaly in the time series analyzed marked with a red dot. It identified it as an anomaly because it wasn’t accurate regarding historical data.
Source: medium.com
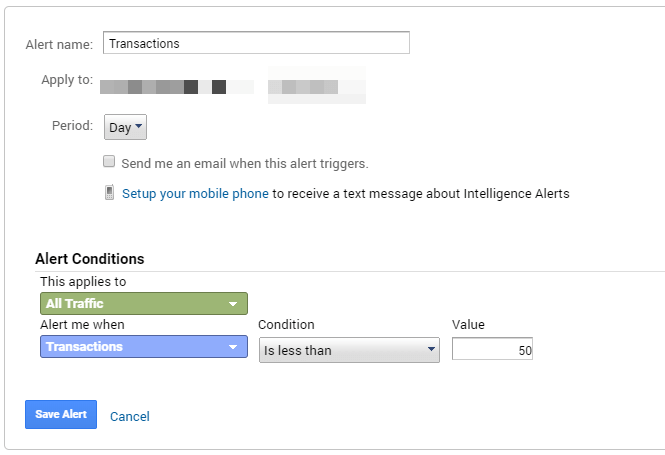
You probably know about Google Analytics alerts. You could find them at Customization » Custom Alerts » Manage Custom Alerts » New Alert. And you could add alerts to keep an eye on the problems that appear. For example, you can have an alert in case your transactions dropped to a specific value.
5. Find the Landing Pages with the Worst Ecommerce Conversion Rate
Finding pages that don’t bring any commercial benefits can be hard to spot and Analytics insights has the information on that. For the site we used on this analysis we received some recommendation of what needs to be improved and one of them was the poor landing pages in terms of ecommerce conversion rate.
We saw that some of your top landing pages performed >25% worse on ecommerce conversion rate this month.
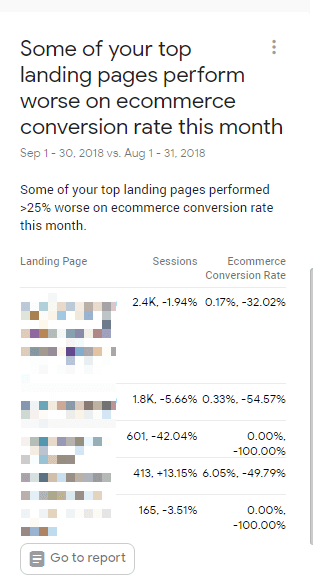
Over the time period analyzed, the overall ecommerce conversion rate of the site was 0.57%, according to the Google Analytics results. Tracking this type of data helps you see the conversion rate and the directions for improving it. For keeping the numbers high you have to keep the content relevant for the type of traffic you have for those pages. You need to answer the following questions:
- If there have been changes in the traffic sources to these pages, have you made sure the content is relevant to that traffic?
- If you changed the content on these pages, did you notice a change in user behavior?
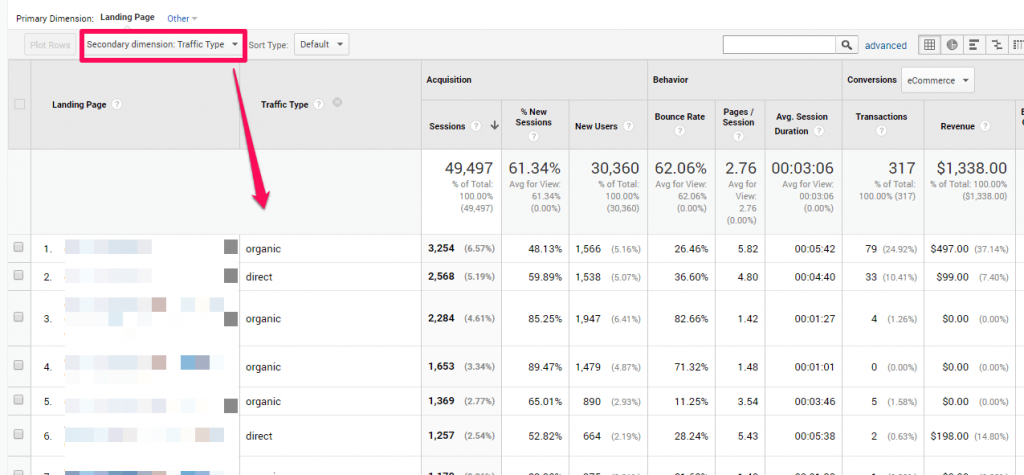
To see the type of traffic you have for your pages, go to Behaviour » Site Content » Landing Pages. Here chose the secondary dimension: Traffic Type.
6. Track the Revenue Trend for Your Products/Services
Once you understand the popularity of certain products and discover what’s accounting for your highest ROI, your business will grow.
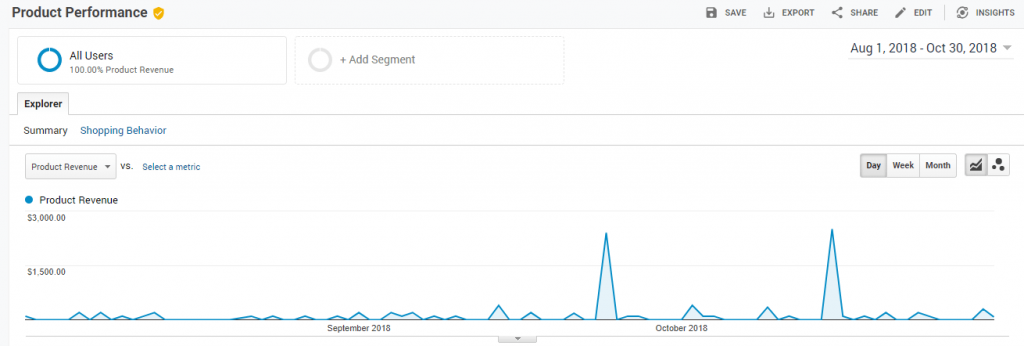
Tracking the revenue trend for your products can be really helpful in understanding what’s working and what products didn’t bring so much revenue. If you search for “Trend of Product Revenue by Product” you’ll see a chart similar to the one below:
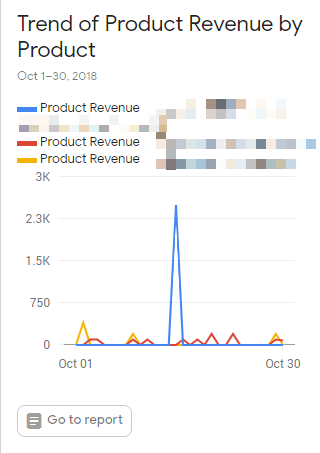
As you can see in the picture above there is a spike in revenue. This chart is very efficient in discovering which products are most effective. So in our case, we should look at the product that had a drastic increase and go further in discovering what we did that day or during the previous days.
I performed the search once more to see if this spike appeared again in the last 3 months by going to Conversions » Ecommerce » Product Performance. And it seems it happened again in October so it wasn’t just a one-time thing, but still the spike is pretty high comparing to the normal growth of the website.
Conclusion
Google Analytics Insights is the online guide that helps you see the missing opportunities, the lacking performance, the anomalies and get recommendations and straight answers to your questions with direct reference to the reports and graphs. Following the above actionable insights we talked about, and looking through the customized reports will give you the chance to improve your Google analytics data, increase sales and perform conversion rate optimization
It is very easy to use. You can ask questions or look for specific metrics and dimensions and Google Intelligence will give you directions to the analytics reports. You’ll get recommendations and see what you should do to improve the metrics and the parts of your website that aren’t performing so well in the sales funnel.


Leave a Reply!